Potatos
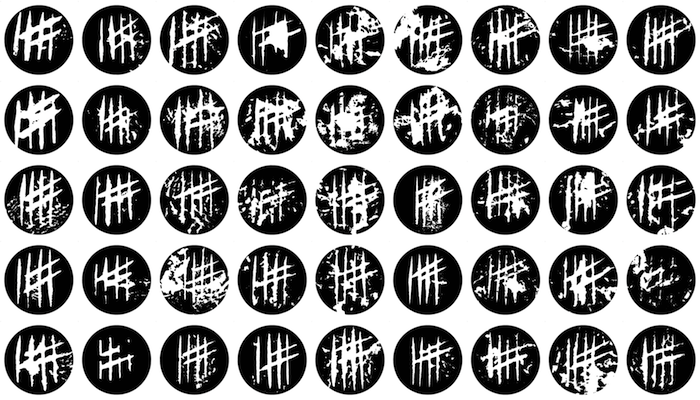
Stimulus materials from a series of studies on visual statistical learning and expertise. Each image comes from a single potato, sliced in half and with a hash pattern carved into the surface, dipped in ink, stamped on a page several times, and the resulting images aggregated using the imager package in R. Collage and image processing by Danielle Navarro, raw images courtesy Kristy Martire, Alice Towler and Bethany Growns.

Bayes in ASCII
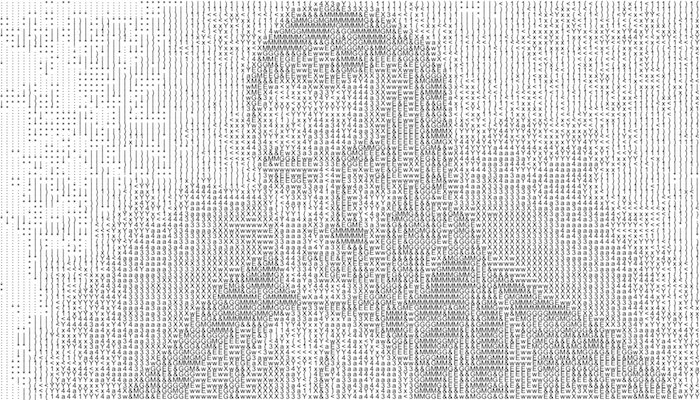
An image of Rev. Thomas Bayes constructed from ASCII characters. The original image was taken from Wikipedia and the ASCII composite made using the imager package in R. Image by Danielle Navarro. The idea of doing this in ASCII is a derivative of Tom Griffiths' lab logo which does the same thing with MNist characters. (Unicode variants here and here)

Bandits
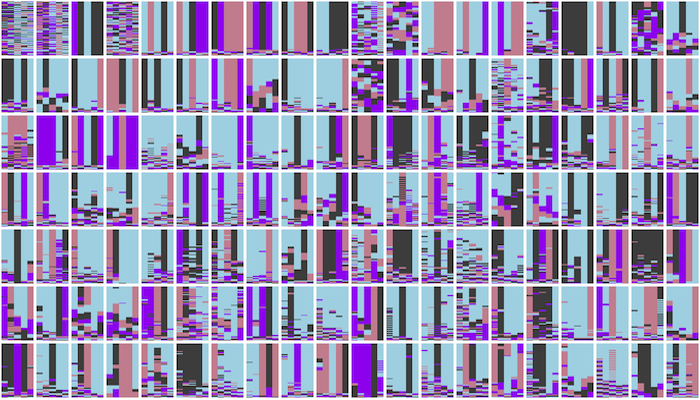
Raw data from a multi-armed bandit task studying explore-exploit behaviour. Each panel depicts data from a single person, organised into five columns. Each column shows a sequence of fifty choices, from bottom to top. The colour of each cell (blue, black, purple, pink) denotes one of four possible choices. Image by Danielle Navarro, raw data from collaborative work with Ben Newell and Jared Hotaling.

Concreteness
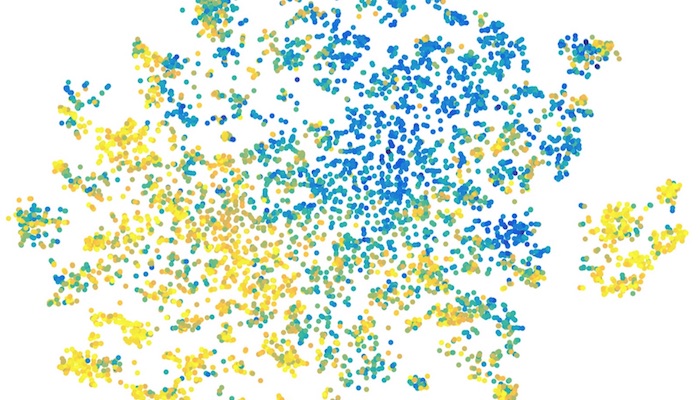
Visualisation of the concreteness of English words, contributed by Simon de Deyne. Each dot depicts a word, and the spatial organisation of dots reflects the proximity of the words within the semantic network. The colour of each dot represents its value on a concrete-to-abstract measure, shown using a yellow-to-blue scale.